Motivation
The Table Dashboard introduced in March 2022 includes a set of upstream table dashboard cell components designed to cover the majority of customer use cases. These components are pre-built and configurable (where applicable), offering a robust and efficient solution out of the box.
We strongly recommend using these upstream components whenever possible for the following reasons:
Minimal implementation effort: No need to write or maintain custom code.
Full feature compatibility: These cells are deeply integrated with existing Livingdocs functionality, such as dashboard filters, metadata plugins, and indexing.
Future-proof: Upstream components benefit from ongoing development, testing, and updates, ensuring continued compatibility and performance.
List of Upstream Table Dashboard Cells
Shown configurations should be applied in a table dashboard via the project config within the editor settings.
liTableDashboardCellStatistics
Shows the statistics of a document.
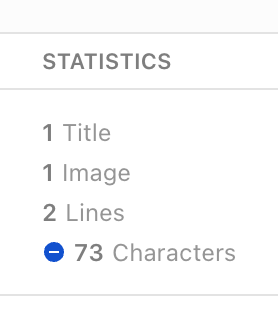
There are multiple componentOptions, which influences how this cell is viewed:
componentCount: Provide an array of component names (strings) to count within the document.hideLabel: Show or hide the label next to a statistic. Useful when only a single value is displayed. And the name of the value is the cell label.hideLineCount: Determines whether the line count is displayed.characterCount: Determines whether the number of characters used is displayed. If a target length is defined in the metadata, the value will be evaluated against it (met, below, or above), and a corresponding icon will be shown.
    label: 'Statistics',                      // string or livingdocs string
    componentName: 'liTableDashboardCellStatistics',
    componentOptions: {
        componentCount: ['p', 'title'],       // Array of components as strings, not required
        characterCount: true,                 // boolean, not required
        hideLineCount: true,                  // boolean, not required
        hideLabel: false                      // boolean, not required
    },
    metadataPropertyName: 'nameOfProperty',   // type string, not required
    editable: false,                          // boolean, default: false
    minWidth: 250,                            // number, required
    growFactor: 2,                            // number, required
    priority: 1                               // number, required