The telemetry stack will assist you in debugging your Livingdocs server instance. It enables you to build dashboards to provide an overview of the server and its surrounding environment, or to dive deeper into the metrics, logs and traces produced by the server.
Setup
Follow the setup instructions in the livingdocsIO/monitoring repository. It should be as simple as cloning the repository and running docker-compose up.
If the Livingdocs server is running in a Docker container on the same server then everything should just work by adding the following to the server configuration file:
{
  ... // Existing config parameters

  // Basic telemetry config
  telemetry: {
    tracing: {
      enabled: true,
      exporter: {
        type: 'otlp-grpc',
        config: {
          url: 'http://localhost:4317'
        }
      }
    }
  }
}
If you’re running this for local development purposes then an additional step is required. As the server logs won’t be available through Docker they need to be sent to Vector instead. Vector is listening for Livingdocs server logs on port 4545 using UDP. pino-socket and pino-pretty, installed as dev dependencies of @livingdocs/server, can be combined to pipe the “un-pretty” logs to port 4545 and then make them pretty again. An example of a command to achieve this is:
logs__pretty=false npm run watch | pino-socket -p 4545 | pino-pretty --ignore ns --translateTime 'HH:MM:ss' --messageFormat '{ns} > {msg}'
Note: Make sure you change
npm run watchto the command you want to use to start the server.
On some systems it might not be possible for Prometheus to scrape the metrics endpoint of the local server too. To check if it’s working by default you can go to the Prometheus Targets page and see if “livingdocs-server” is up or down. If it’s up then you’re done! If it’s down then you’ll need to use the opentelemetry-collector target instead. To enable it update your server configuration with the following:
{
  ... // Existing config parameters

  telemetry: {
    ... // Existing telemetry parameters

    metrics: {
      exporter: {
        type: 'otlp-grpc', // one of otlp-grpc, otlp-http or otlp-proto
        config: {
          url: 'http://localhost:4317'
        }
      }
    }
  }
}
Configuration
The telemetry object in the server configuration is as follows (with defaults provided):
{
  serviceName: 'livingdocs-server', // defaults to the name in the package.json

  // Tracing
  tracing: { // Tracing configuration used within livingdocs-server
    enabled: true, // defaults to false
    exporter: {
      type: 'otlp-grpc', // one of jaeger, otlp-grpc, otlp-http or otlp-proto
      config: {
        url: 'http://localhost:4317'
      }
    }
  },

  // Metrics
  metrics: { // Metrics configuration used within livingdocs-server
    enabled: true, // defaults to true
    port: undefined, // if no port is defined, we expose metrics on the default http server port
    collectDefaultMetrics: true,
    defaultMeterName: serviceName, // defaults to the name in the package.json
    exporter: {
      type: 'otlp-grpc', // one of jaeger, otlp-grpc, otlp-http or otlp-proto
      config: {
        url: 'http://localhost:4317'
      }
    }
  }
}
Most of the options available are forwarded to the various @opentelemetry libraries used by the server, and it’s not necessary to configure them. Please see the documentation for each npm package mentioned in the descriptions for further details of configuration options available. The telemetry.tracing and telemetry.metrics objects are used internally by @livingdocs/server to enable or disable certain features.
Usage
Once everything is configured and operational you can go to the Grafana user interface at http://localhost:3000/ and log in using the default Grafana user (admin/admin).
At this point you should be able to create new dashboards full of beautiful graphs, gauges and tables, as well as exploring/querying Jaeger, Loki, and Prometheus data and setting up alerts for outages, usage spikes, or errors.
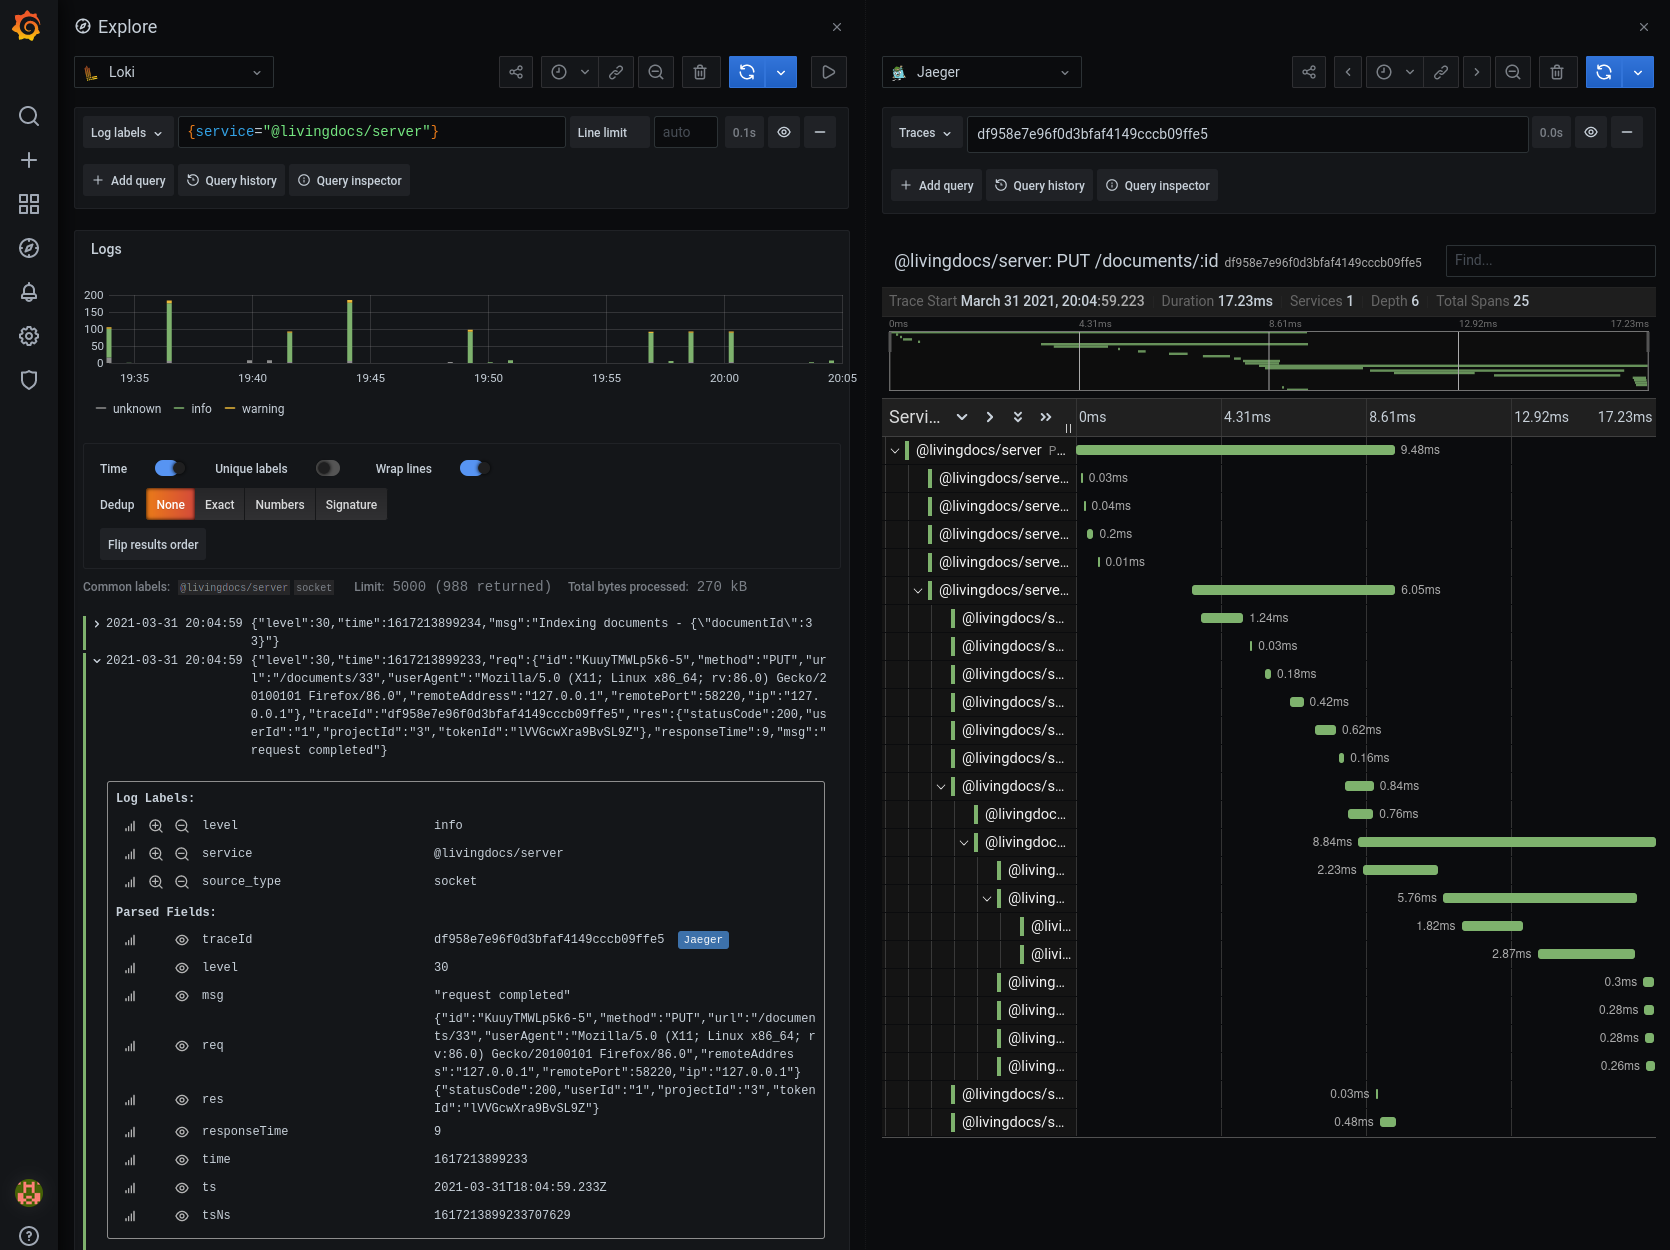
An easy way to start is to click on the Explore icon in the left panel, select Loki as your datasource from the dropdown at the top of the page, and then click on a HTTP request log. If you need help finding a log try the following query: {service="@livingdocs/server"} |= "PUT". There are many ways to query the logs, and you can find more information about them in the Loki LogQL documentation. Once you’ve expanded the log you should see a traceId value in the “Parsed Fields” section. Click on the “Jaeger” link to inspect the Jaeger trace timeline and spans.
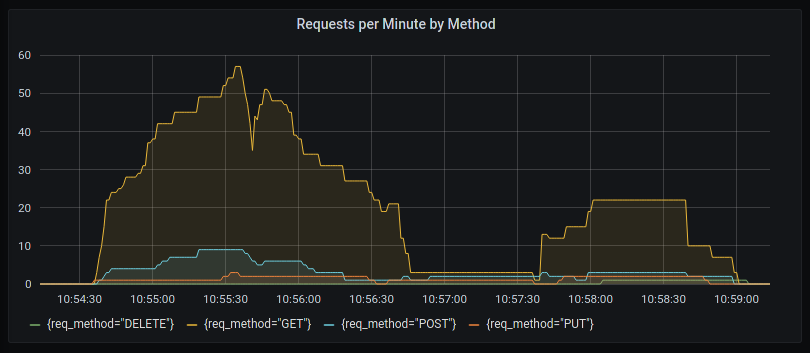
Along with querying logs you can also create graphs in a dashboard using the log data. Click on the Dashboards icon in the left panel, and then click on the “Create your first dashboard” tile. Add a new panel, and make sure you have the Graph visualization highlighted. In the Query tab select Loki as your datasource and enter sum(count_over_time({service="@livingdocs/server"} | json | __error__!="JSONParserErr" | req_method != "" [1m])) by (req_method) as your Loki query. You should end up with something similar to the following image (assuming you have made some requests on the website recently):
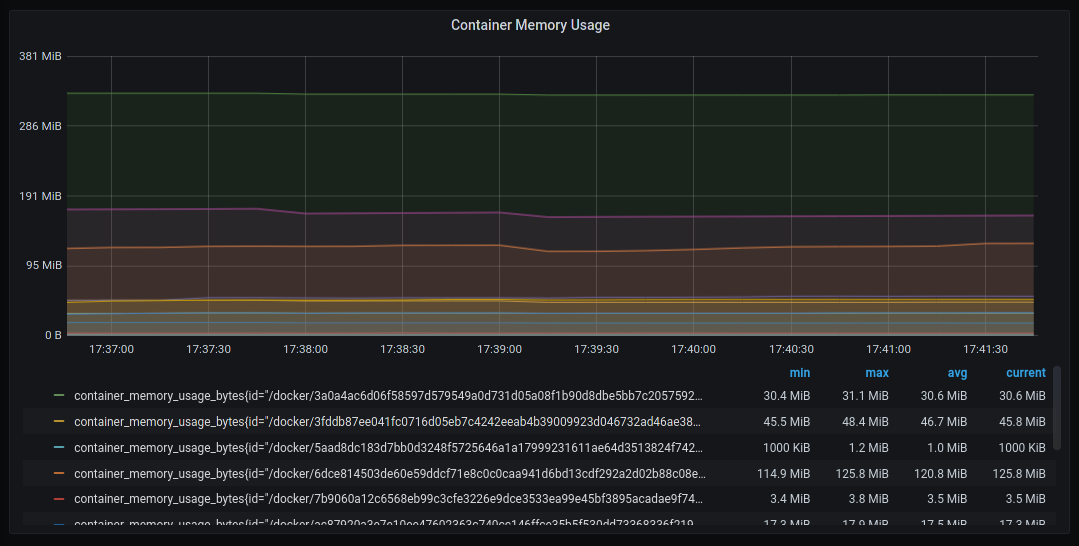
Another way to create dashboard graphs is to use the Prometheus datasource. Add a new panel, select Prometheus as your datasource in the Query tab, and try adding container_memory_usage_bytes as your PromQL query. The panel can be tweaked by making alterations in the left sidebar, such as setting the title, selecting the Y-axis unit, or showing additional values in the legend:
Stack
The livingdocsIO/monitoring repository runs a number of containers, and while Grafana should contain all of the information you require, there are some additional user interfaces exposed that can be accessed by following the “[Local UI]” links listed in the container summary below:
- cAdvisor [Docs] [Local UI] - Provides resource usage and performance metrics of Docker containers to Prometheus
- Grafana [Docs] [Local UI] - UI to explore logs and metrics using queries, charts, and alerts
- Jaeger [Docs] [Local UI] - Provides tracing data which is linked to each incoming Livingdocs server request
- Loki [Docs] - Ingests logs which can be viewed and queried from within Grafana
- OpenTelemetry Collector [Docs] - Collects metrics data from Livingdocs server and exports the data to Prometheus
- Prometheus [Docs] [Local UI] - A monitoring toolkit for timeseries based metrics
- Vector [Docs] - Transforms Docker logs and send them to Loki, as well as collecting logs from local Node.js processes if required